max planck institut
informatik
informatik

|
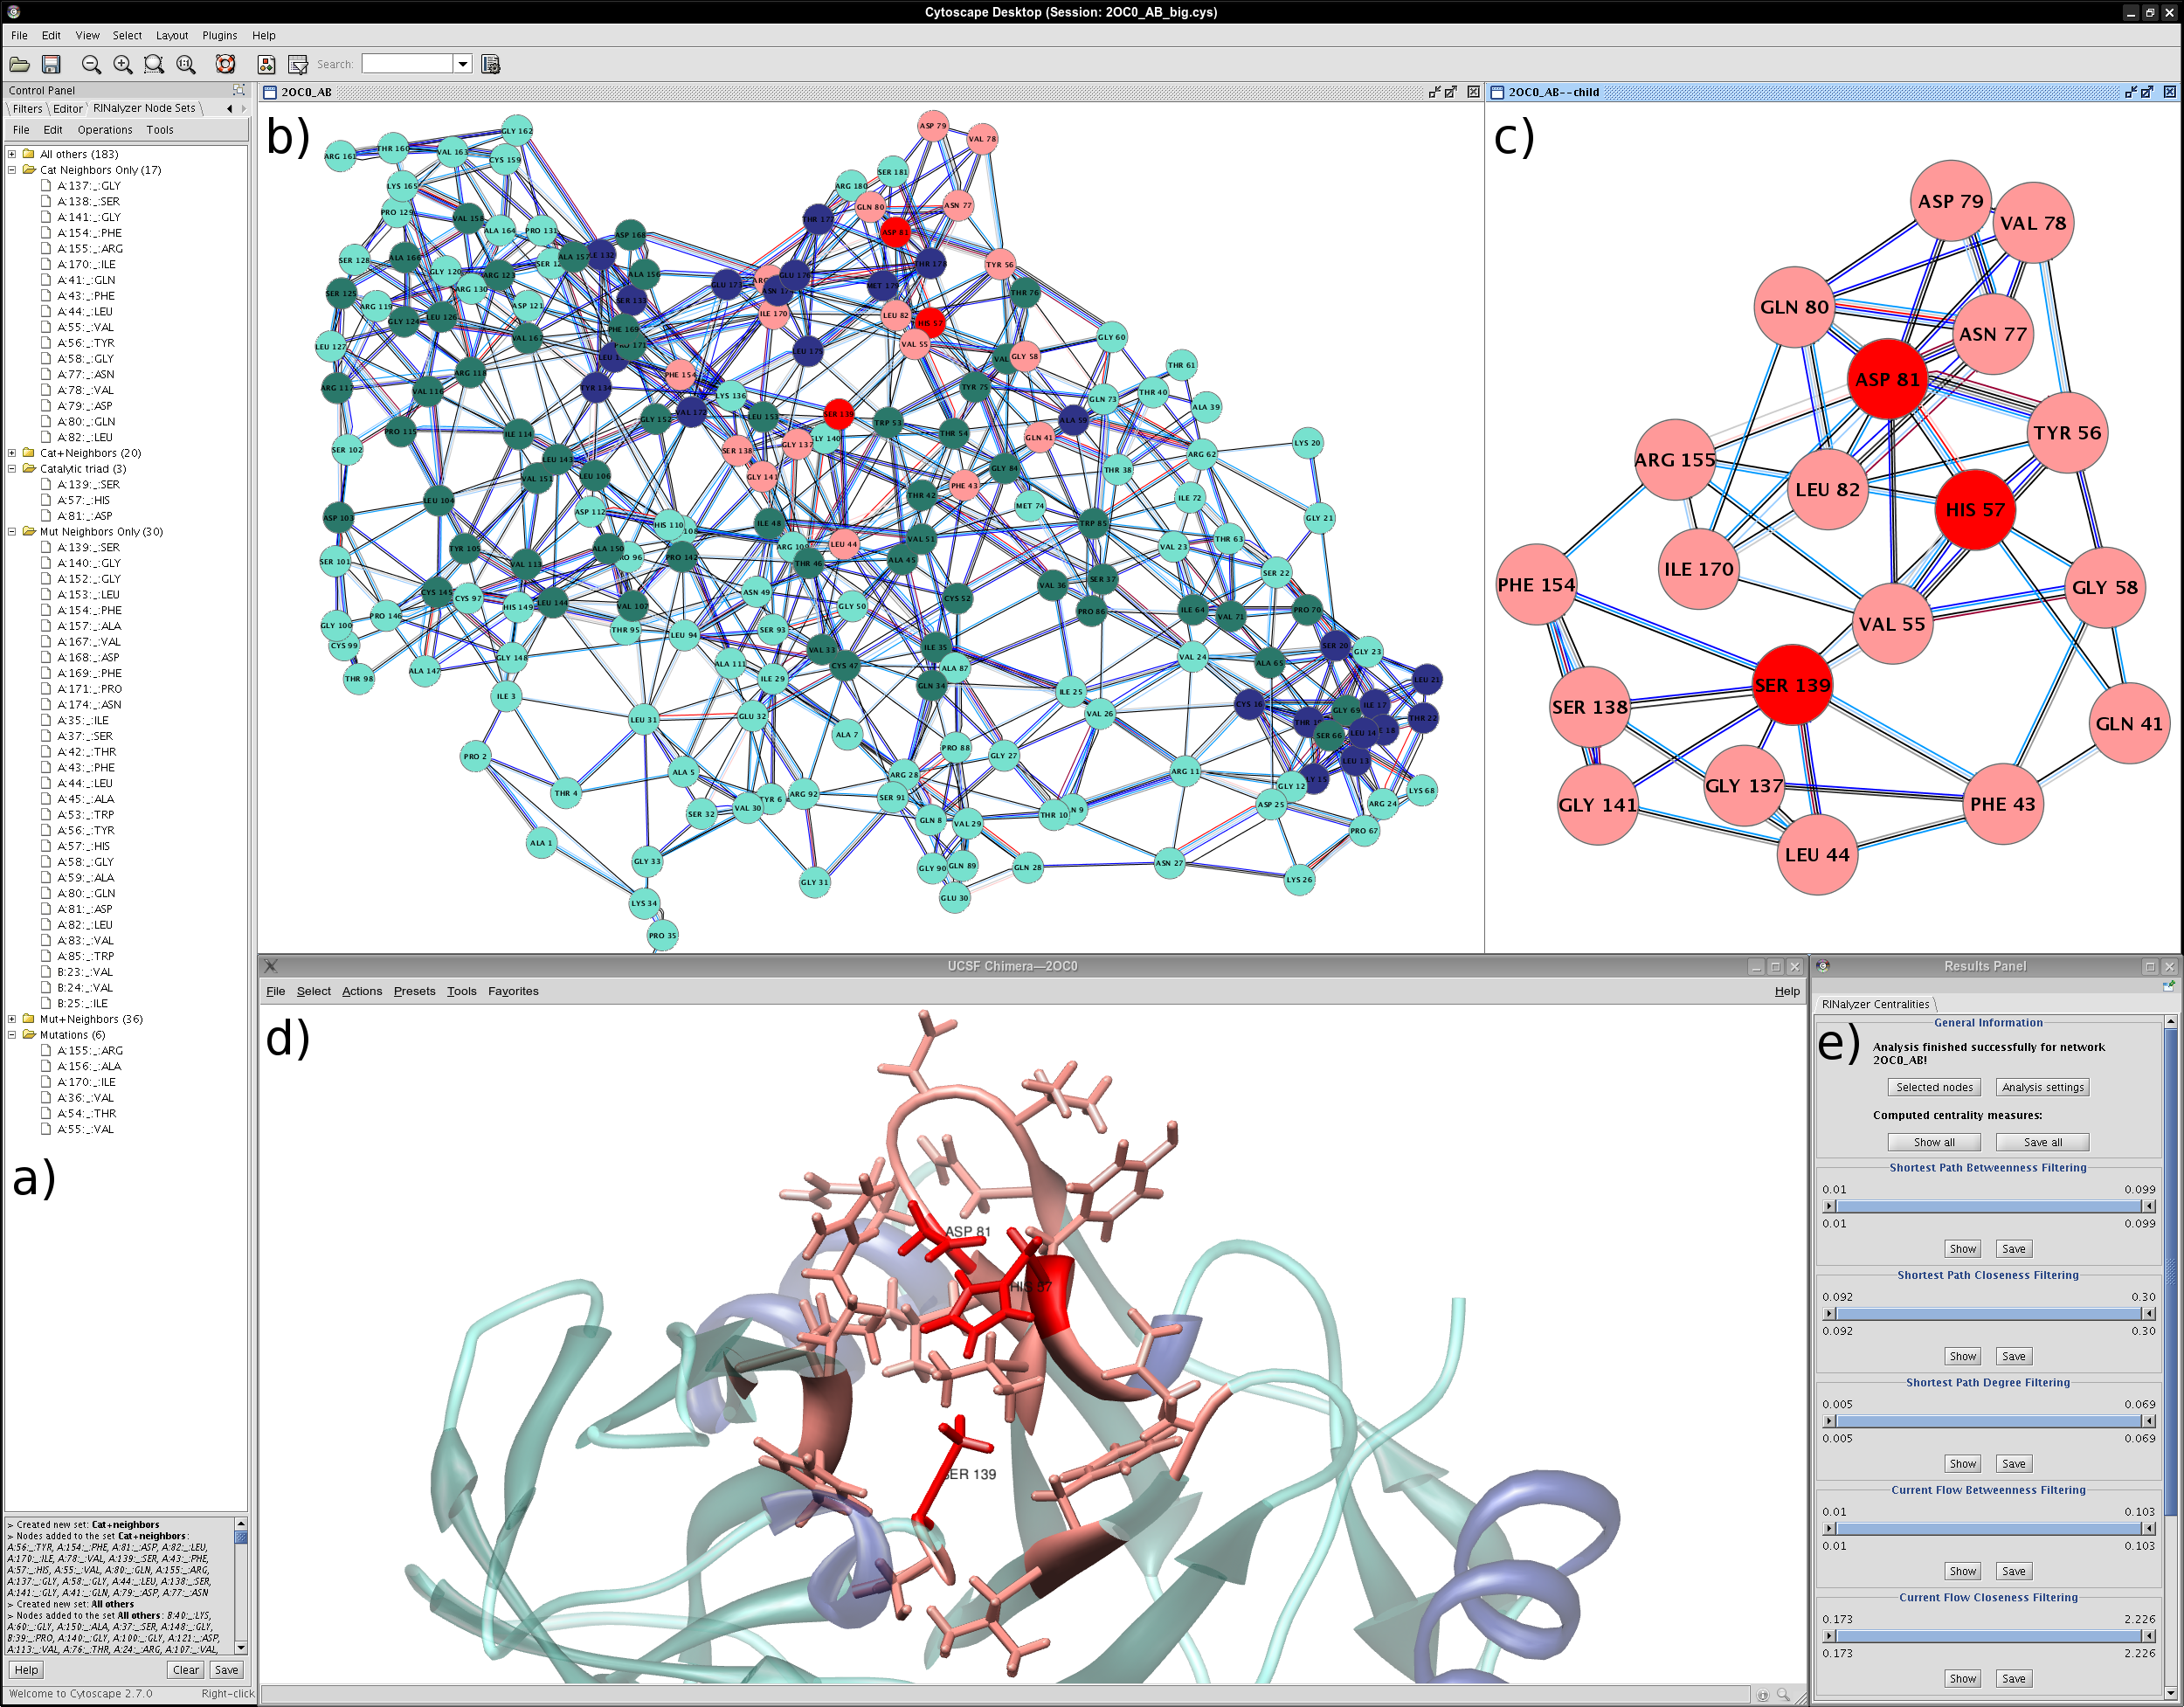
Example 1: Visual analysis of the NS3-4A protease of the hepatitis C virus and the corresponding residue interaction network (click on the image to enlarge it)
1Catalytic site residues/nodes are in red, their interacting residues/nodes in pink, and all other residues/nodes are colored according to secondary structure (dark blue for helices, dark green for strands). |
 |
|
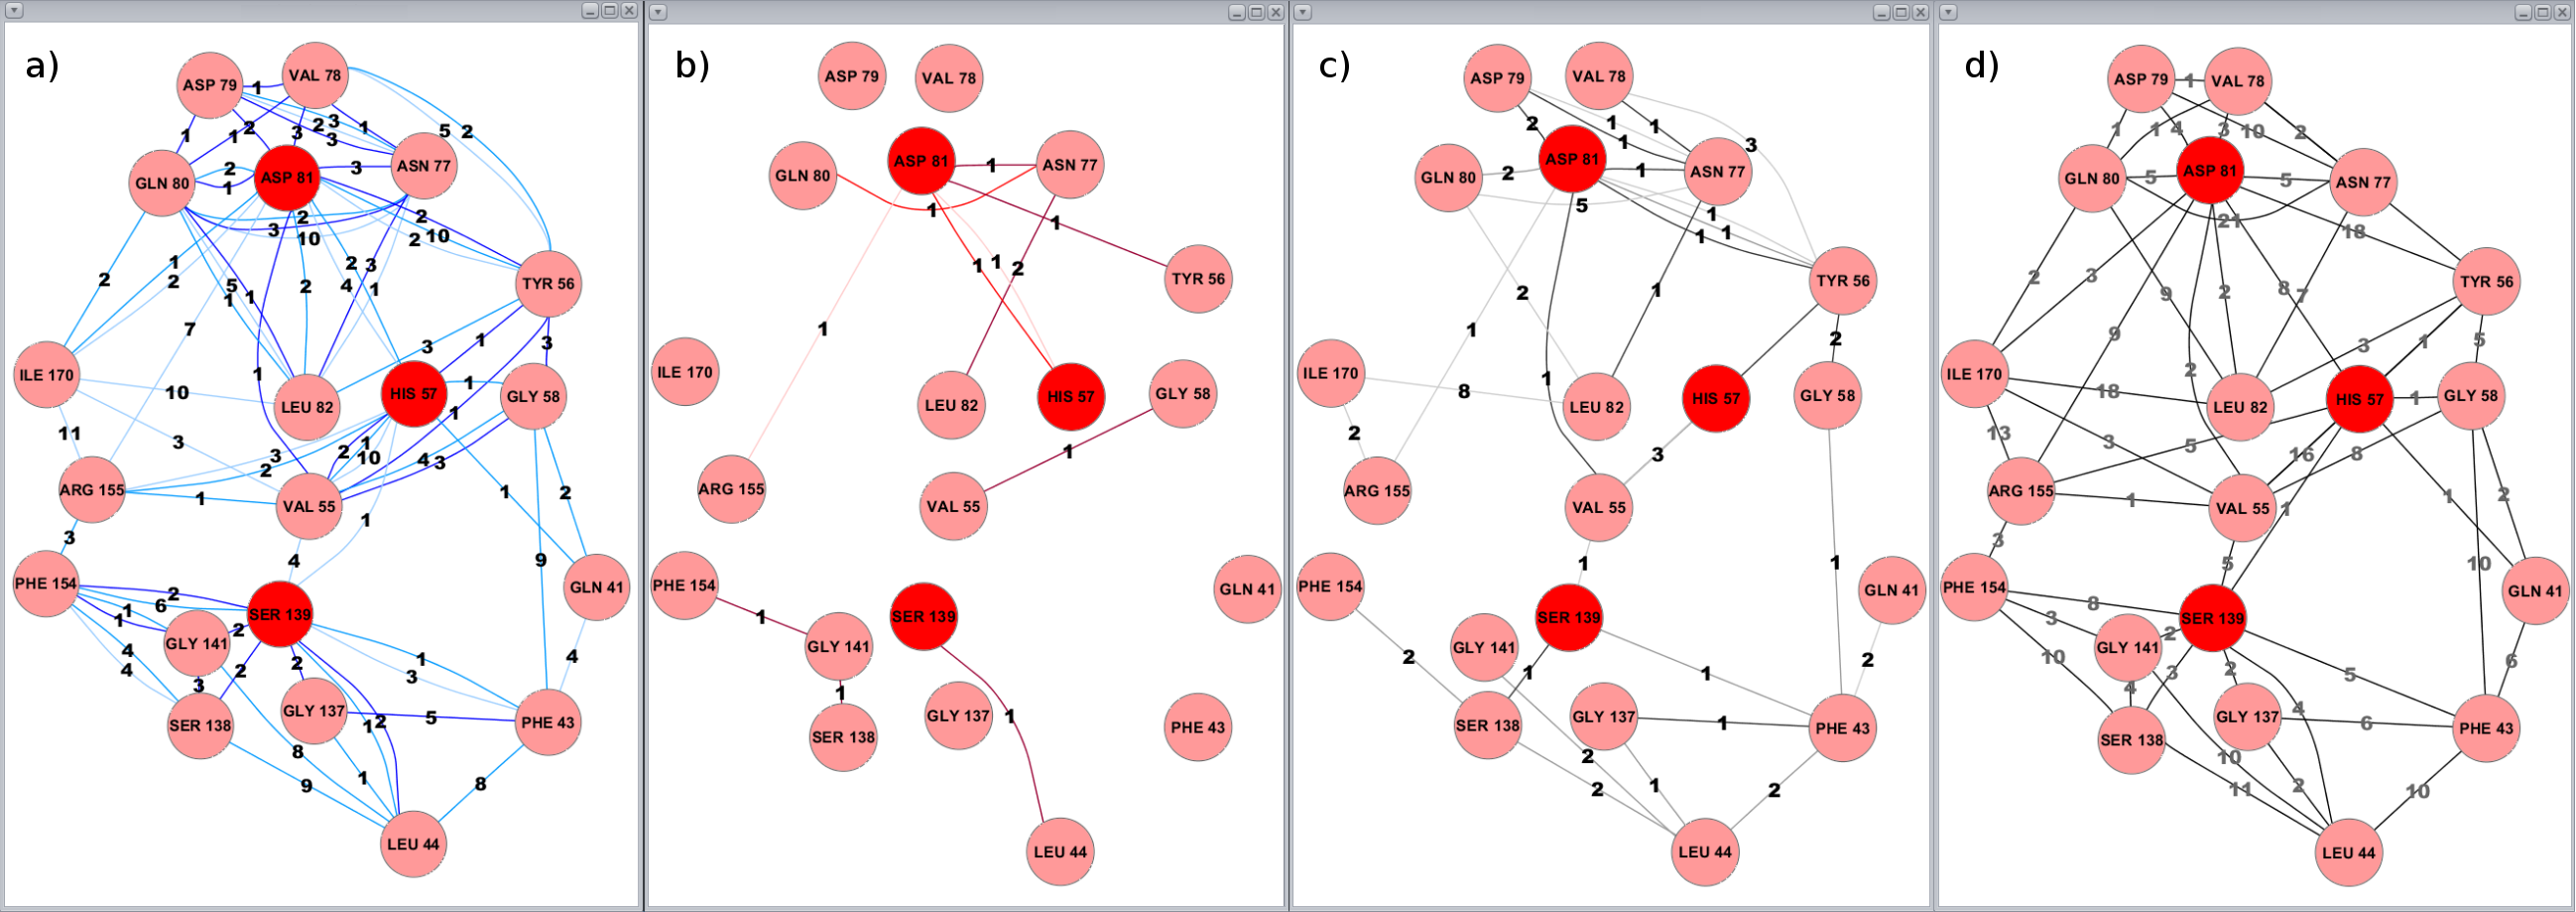
Example 2: Illustration of the non-covalent residue interactions in the catalytic site of the hepatitis C virus NS3-4A protease of the hepatitis C virus (click on the image to enlarge it)
Edges are labeled with the number of interactions of the corresponding type. |
 |
|
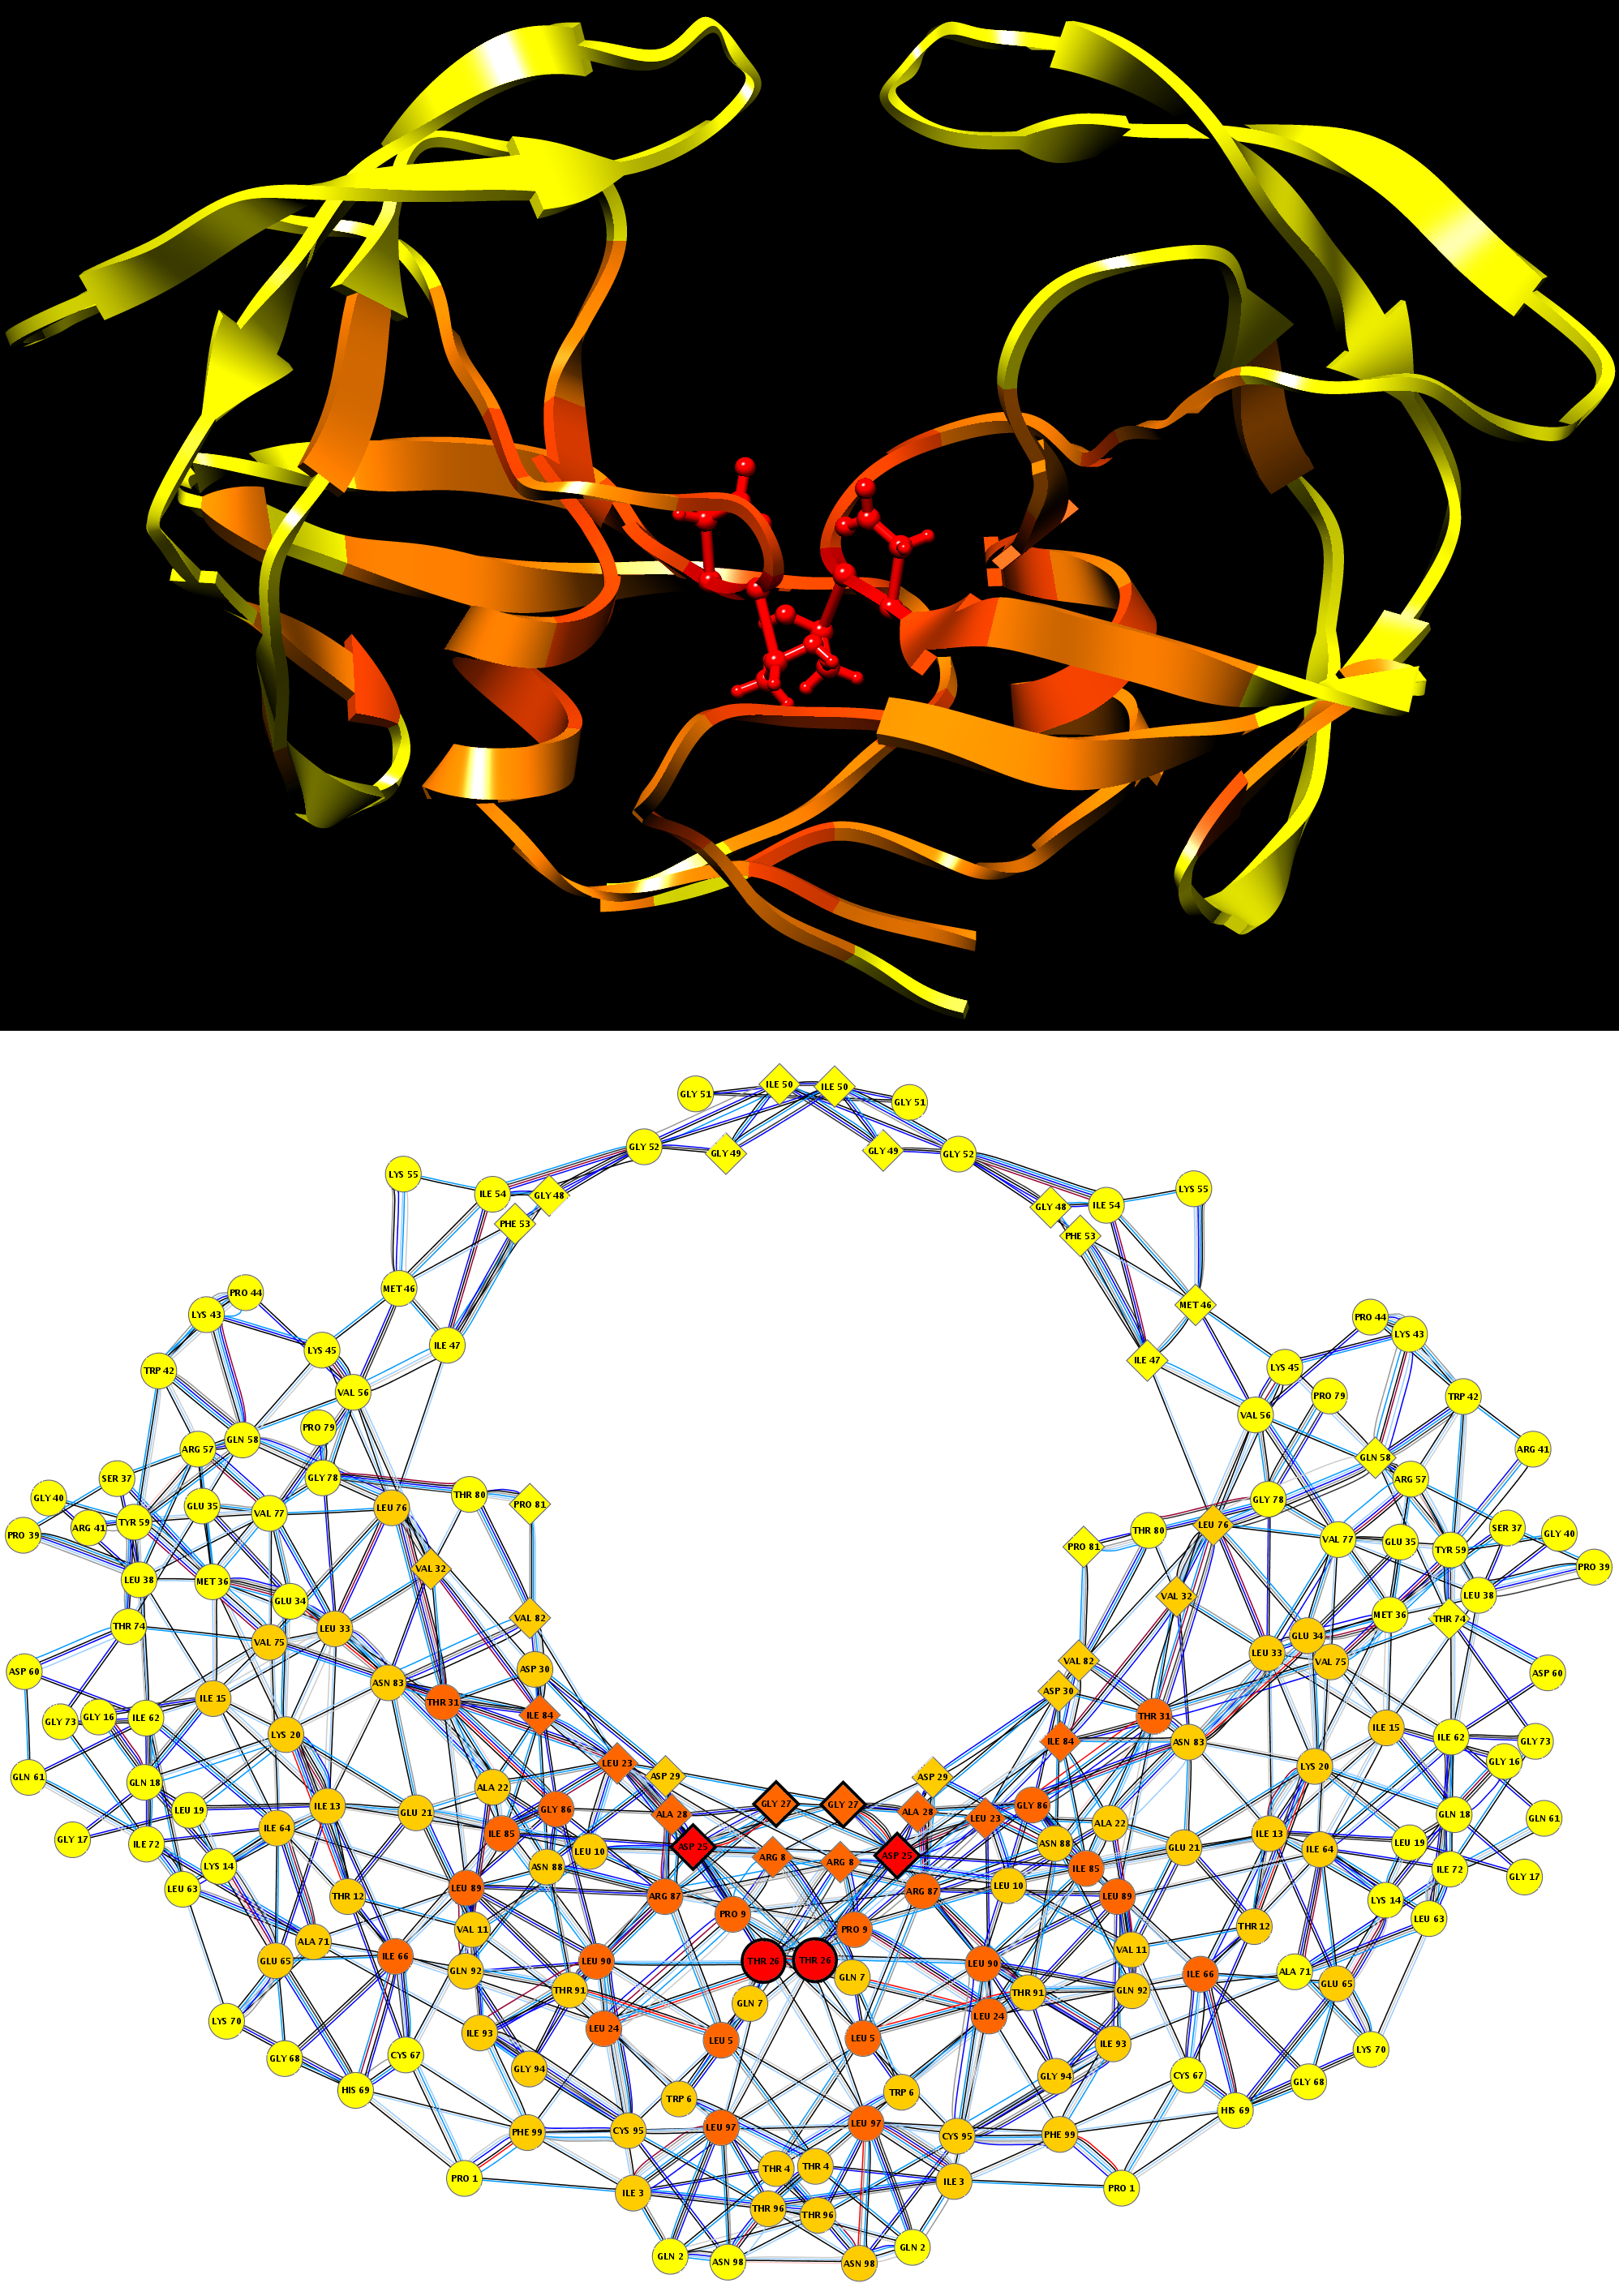
Example 3: Centrality analysis of the RIN derived from a wild-type HIV-1 protease structure (PDB identifier 3PHV) (click on the image to enlarge it) Unweighted shortest path closeness is computed for each node in the network, and the centrality values are converted to standard scores (Z-scores). Both the HIV-1 protease residues and the corresponding network nodes are colored according to the shortest path closeness Z-scores:
Catalytic residues are shown as balls and sticks in the molecular view, and highlighted by thicker node lines in the network view. Residues interacting with a bound substrate (PDB identifier 1KJF) are represented by diamond-shaped nodes in the RIN of the HIV-1 protease. |
 |
|
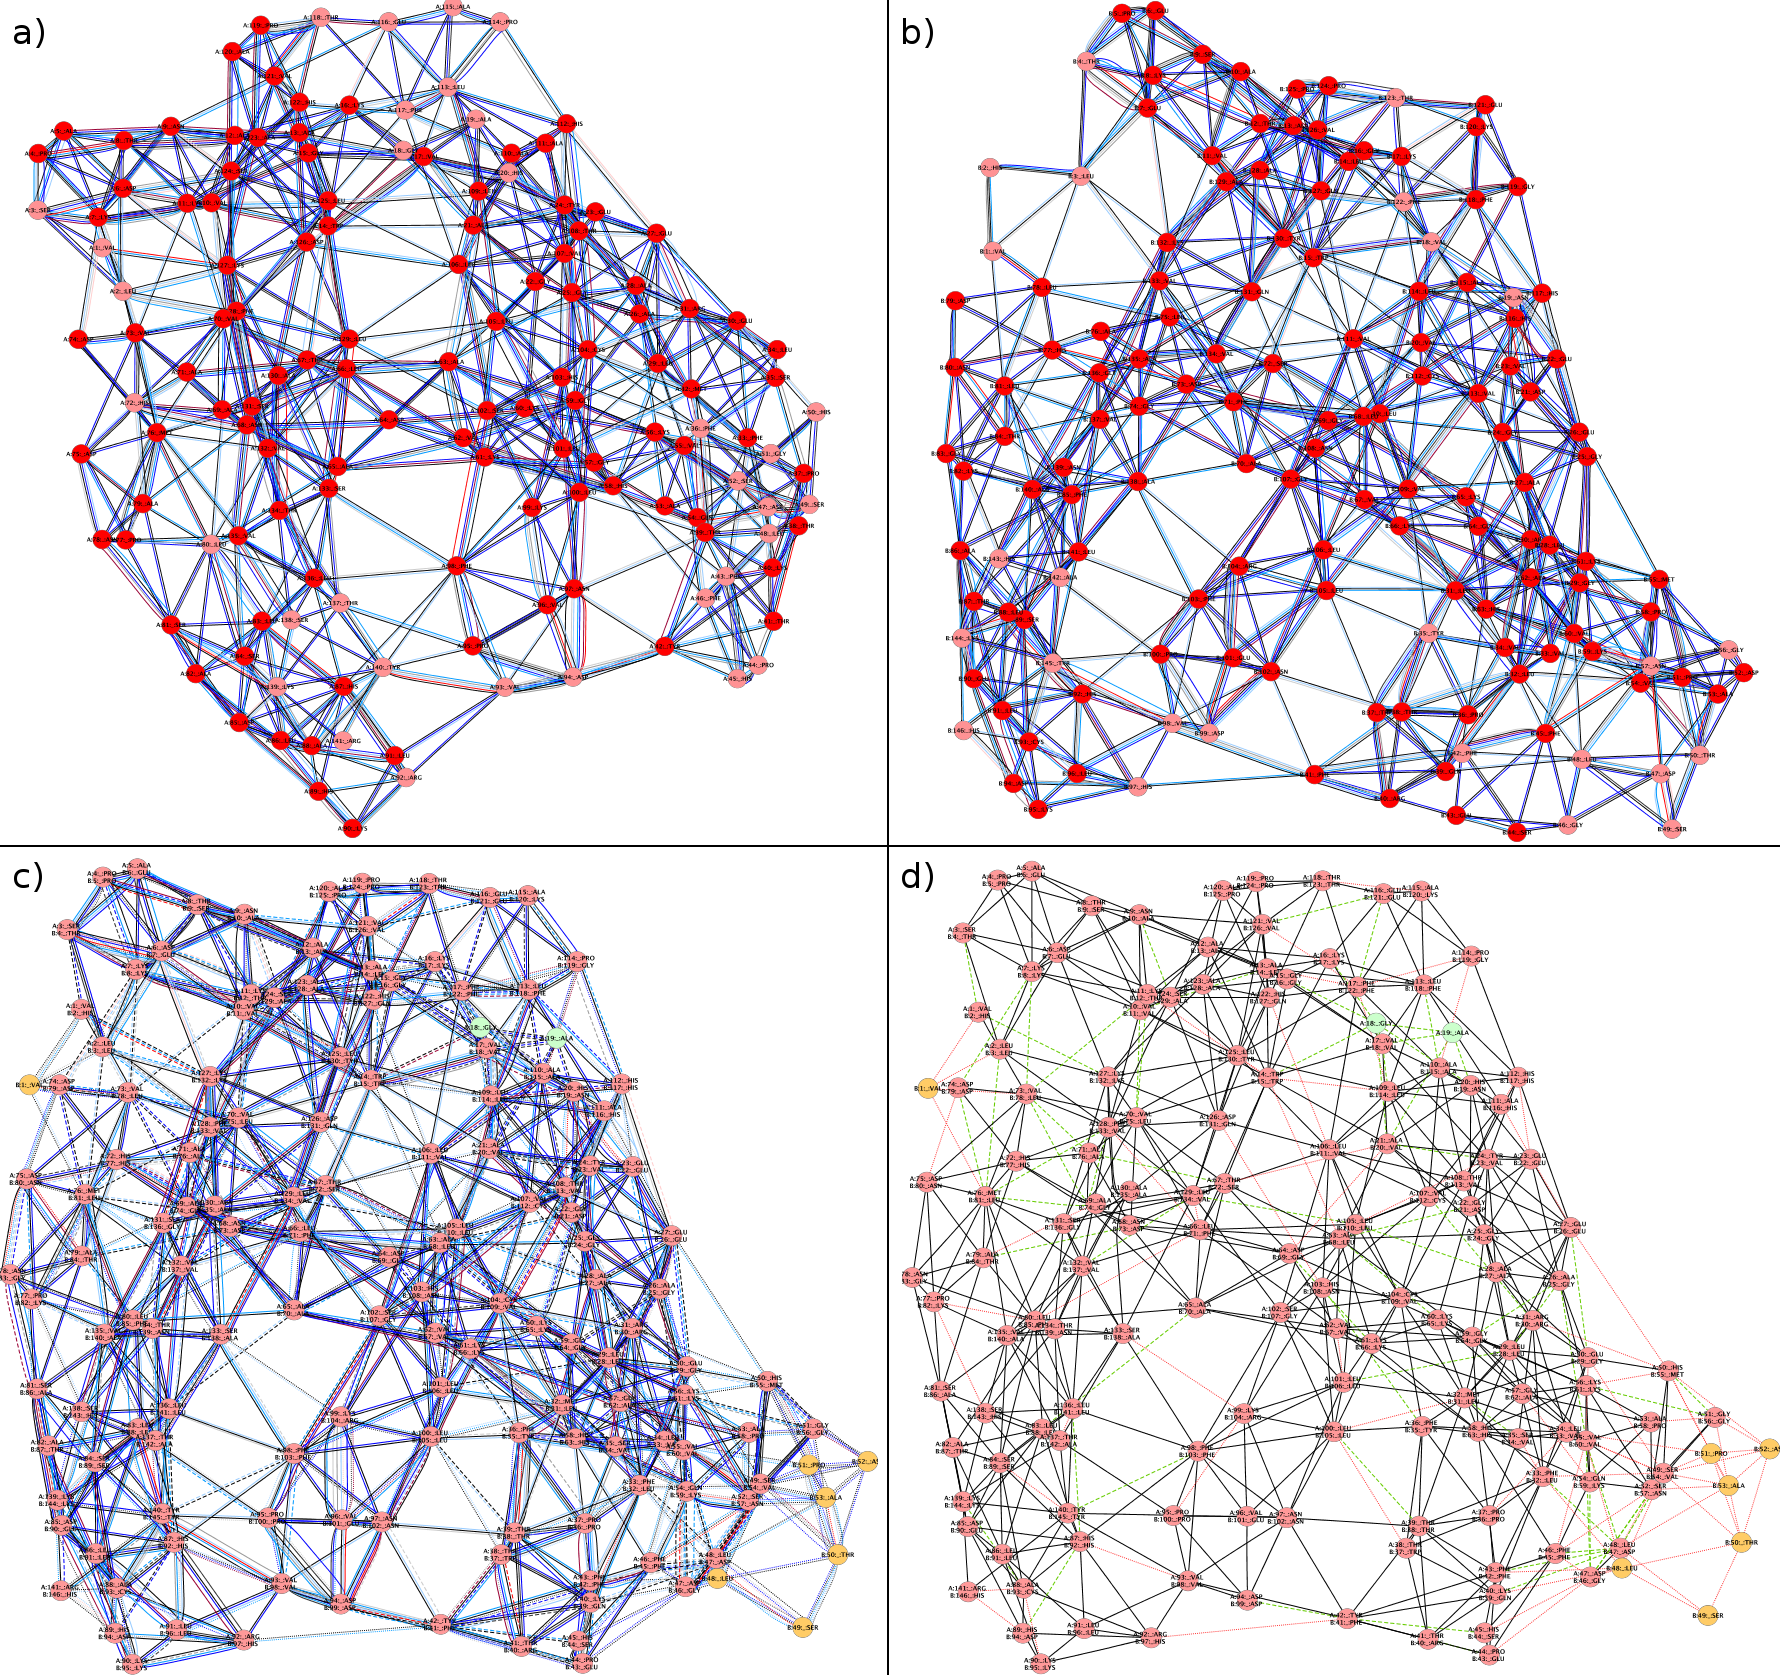
Example 4: RIN comparison of the alpha and beta chain of Deoxyhemoglobin based on an alignment of the corresponding 3D protein structures (click on the image to enlarge it)
1Nodes colored according to secondary structure (red for helices, blue for strands). |
 |